A lot of apps show you "how many questions you did" and leave it there. On PSCPrep.ai, your Progress page turns mock and practice data into something you can act on: a topic heatmap, risk buckets, and a clear daily and weekly mission. Here's what each part means and how to use it.
Coach guidance
One summary, from your mocks only
Once you've taken at least one full mock, we run your answers through an analytics layer that looks at topic and subtopic, not just overall score. The result is a short coach summary: where you're weak, where you're on track, and what to do next. That summary is based only on your mock attempts — so it's exam-style pressure, not casual practice.
Risk buckets
Topic × subtopic × trend
We slice your mock performance into buckets: e.g. "Polity — Fundamental Rights — recent years" or "Economy — Budget — older papers." Each bucket gets a risk level (high / medium / low / on track) and an accuracy gap vs a target. So instead of "I'm bad at Polity," you see "Fundamental Rights in recent PYQs: 35% — needs focus." That's what we use to build your daily and weekly missions.
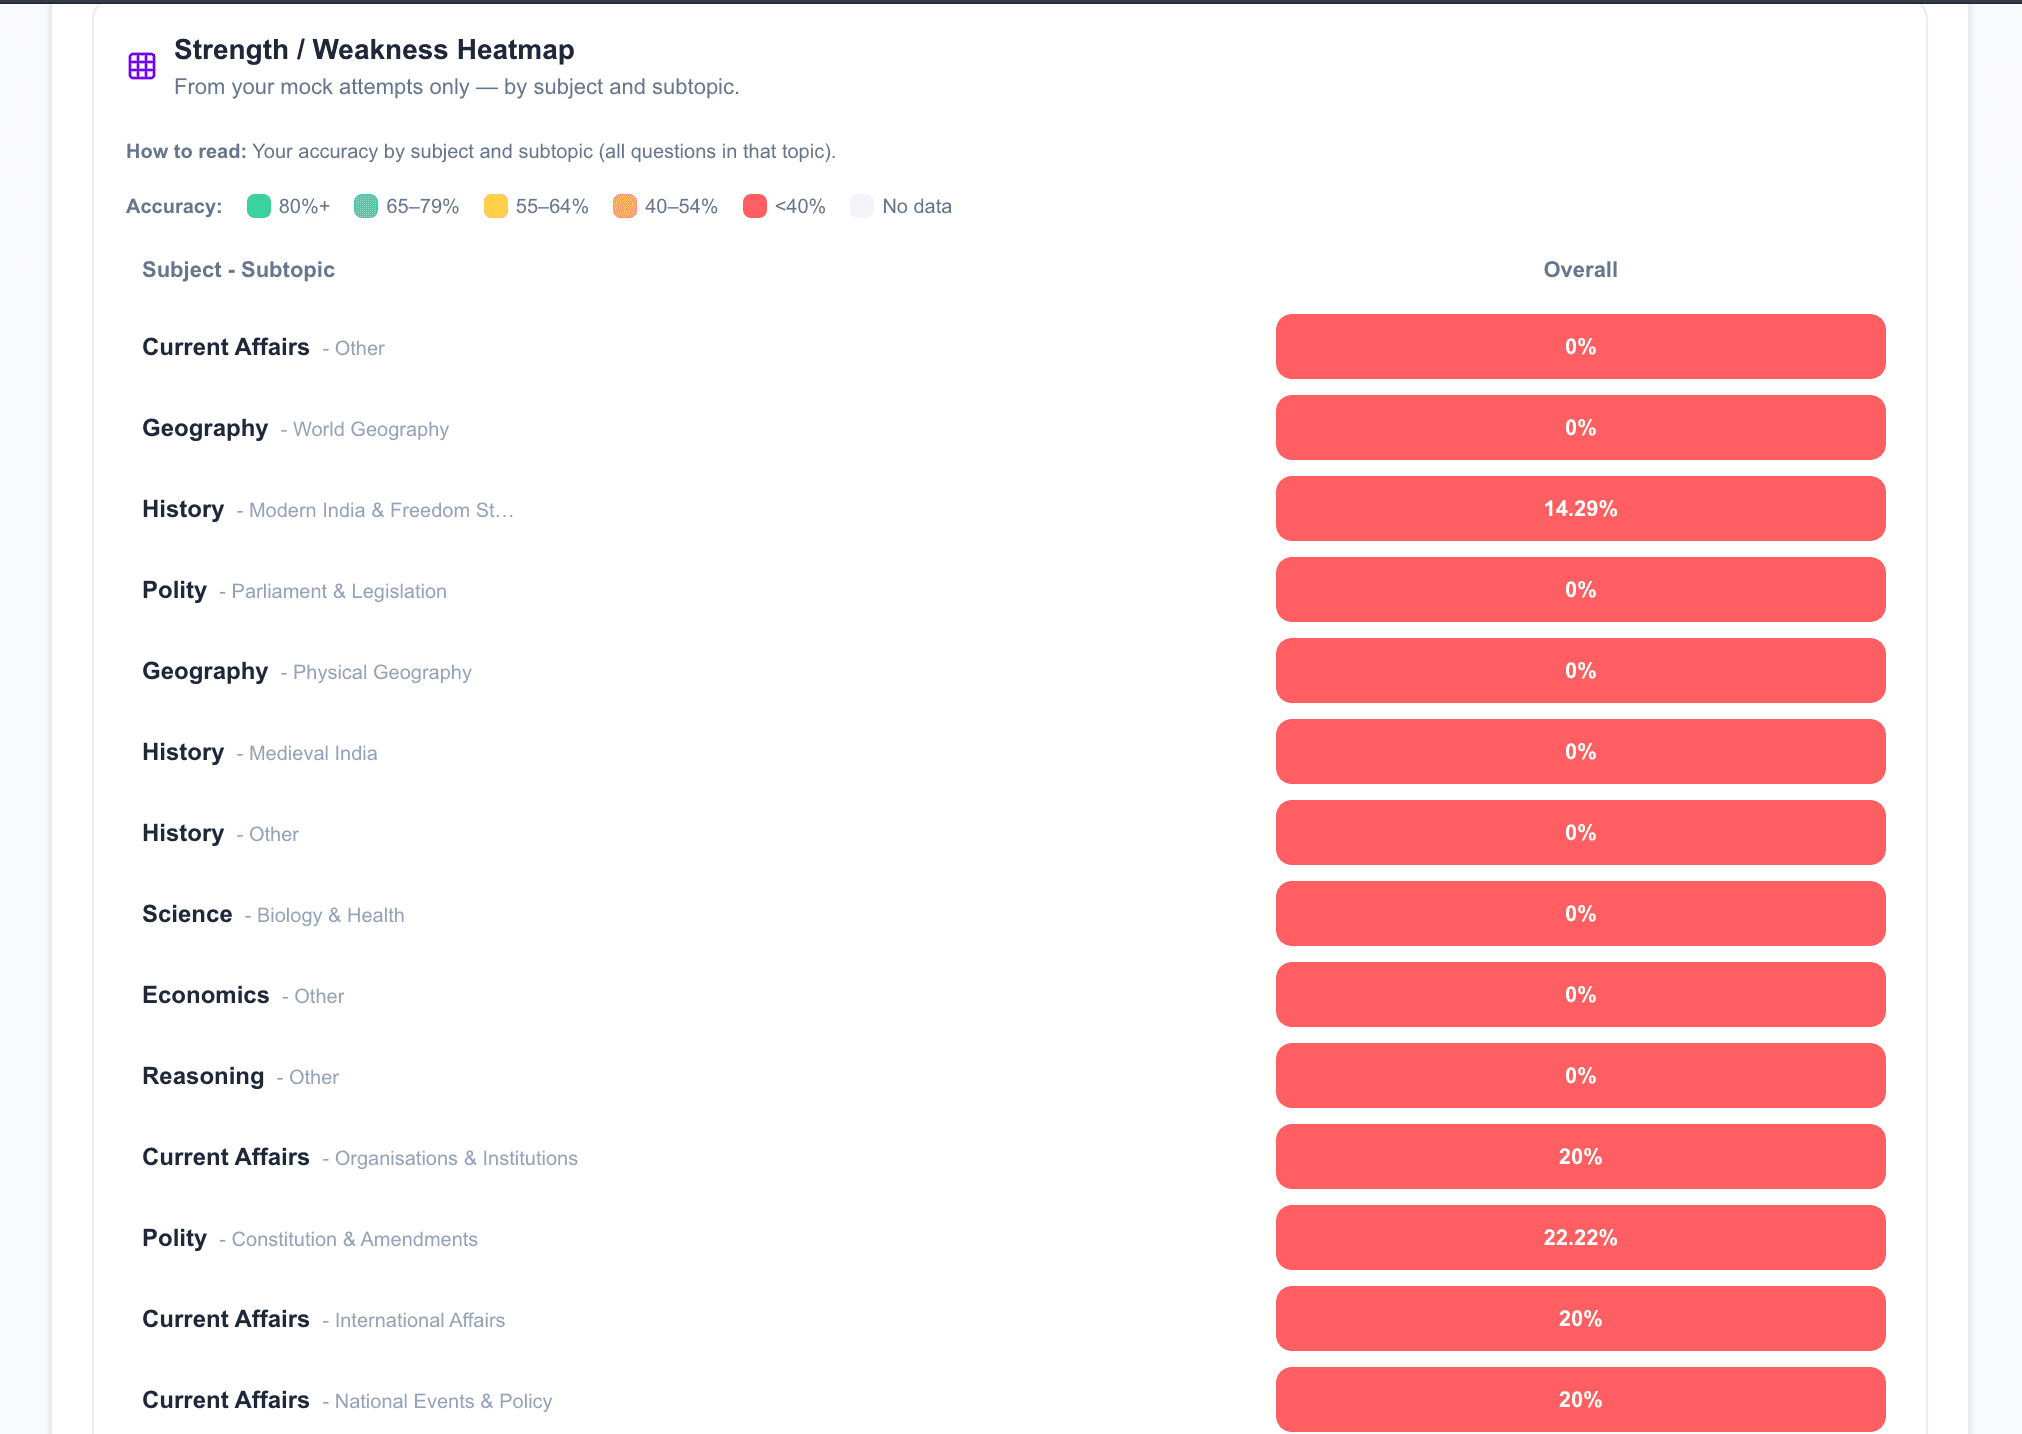
Strength / weakness heatmap
See the full grid
Below the coach block, you can expand a heatmap: rows are subjects or subtopics, and the grid shows where you're strong (green) vs weak (red) from your mocks. It's the same data that drives risk buckets, in visual form. Use it to spot patterns — e.g. "I'm fine in older PYQs but slip in recent years" — and to double-check that your daily mission matches what you see.
7-day activity and topic performance
Practice and mocks, side by side
The Progress page also shows your last 7 days of practice (questions per day, accuracy) and all-time topic performance from practice sessions. So you have one place for: (1) what to do today and this week (missions), (2) where you're at risk (buckets + heatmap), and (3) how consistently you're practising (activity + topic bars).
Key takeaways
- 1Coach summary, risk buckets, and heatmap are built from your mock data — topic and subtopic level.
- 2Daily and weekly missions are one-click practice sets tied to your weakest buckets.
- 3Use the heatmap to see strength/weakness at a glance; use missions to act on it.
- 4Take mocks to unlock the full Progress analytics; practice stats are always visible.
See your Progress
Take a mock, then open Progress to get your heatmap, risk buckets, and daily mission.
Start free